A Smarter Approach To Site Safety, Post Pandemic
Jochen Schaal, managing director of SoundPLAN GmbH, and Michel Rosmolen, director of SoundPLAN Asia, outline the benefits of technology.
Actions to safeguard people against COVID-19 have permeated all areas of our lives, especially safety at work. From physical distancing of people, redesign of industrial and office spaces, mask wearing, personal protective equipment, and regular cleaning – health and safety professionals have had to rethink many procedures. Part of that rethink has been to turn to data and technology to help make the right decisions.
When you are navigating risk, a best guess isn’t going to see you through a crisis. Informed decisions can only be made by analysing the facts. Data can also be used to track the impact of our subsequent behaviour changes on the virus and on our environment, including noise and air pollution.
There are many work-related hazards that existed before COVID-19 struck us, and which still remain a threat to our wellbeing, including excessive noise.
Data from the Central Pollution Control Board (CPCB) which tracks noise-levels through monitoring stations, found that almost every part of India’s six metro cities, violates noise pollution standards.[i] Not surprisingly, the study, conducted in 2018 (the latest year for which data was available), found that the noisiest parts of the cities studied are in commercial and industrial areas.
In its 2021 ‘World Report on Hearing’, The World Health Organization indicates that there are currently 401 million people in the South-East Asia region living with hearing loss. By 2050, it estimates that 666 million people are projected to have problems with their hearing.[ii]
Health and safety professionals have always been aware of this risk, but the silence in our streets during the pandemic has made us all more aware that it’s not cities themselves that create noise, but the people within them. Data from seismologists[iii] undertaken in March 2020 in numerous major cities, such as London and Los Angeles, show that average noise levels decreased, due to less traffic and reduced industrial activity.
Working safer and smarter
We are all going to have to work extremely hard on the road to recovery from this pandemic, so we might as well be smarter about it, by using the best technology and data possible. As restrictions are eased, the Indian government and industry must work hard to ensure that complacency doesn’t creep in and continue to protect people and places.
Moving forwards, focus should not only be the virus risk, but also on a range of other factors that impact our wellbeing, including air and noise pollution, and encouraging clean energy solutions. As a specialist in noise control and mapping software, we are convinced that even after the pandemic, levels can be systematically decreased.
It is not hard to recognise nuisance noise, but identifying its exact source and field of propagation can be a very different matter. If you are going to reduce it and mitigate its harmful effects, then you need to know as much about it as possible. To be truly effective, any attempts at its control must be based on an accurate analysis rather than guesswork or reference to previously recorded levels.
Smart solutions bring together infrastructure and technology to improve and connect urban development.[iv] The Indian government has recognised the importance of this through initiatives such as its ‘Smart Cities Mission’,[v] which aims to drive economic growth and improve the quality of people’s lives, by enabling local area improvements and harnessing technology, especially options that lead to Smart outcomes.
One example is Internet of Things (IoT) technology, which enables objects (devices, buildings, and other items embedded with electronics, software, sensors, and network connectivity) to communicate with each other through the internet. This includes noise sensors, online noise monitoring platforms, and noise mapping software.
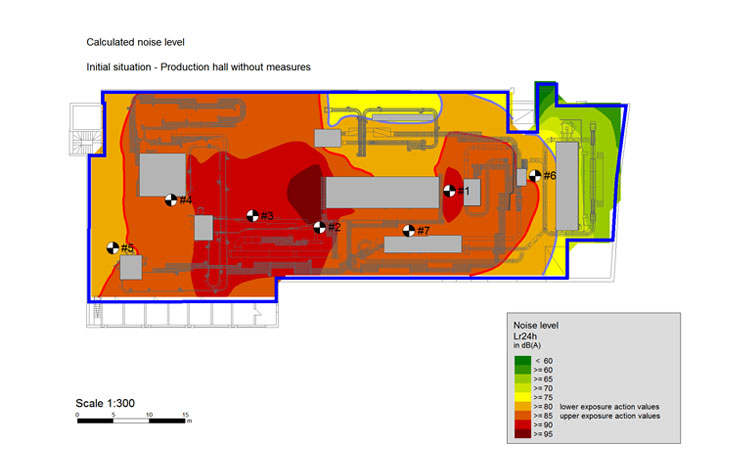
Advances in technology mean that, not only can existing noise be calculated and moderated, but by using mapping software, future levels can be predicted and assessed before projects have even begun. Using this simulation software, a visual demonstration of where the noise comes from, and how it propagates, can be produced.
Noise at work
Industrial noise causes significant health issues for workers and the potential for litigation against any company not taking the necessary steps to protect their staff. It also impacts on environmental noise levels in public places. This comes from a combination of sources including industrial activity, construction, public address systems, music systems, vehicular horns, and other mechanical devices. To control this noise, the Government enacted the India Noise Pollution (Regulation and Control) Rules, 2000[vi], in exercise of its powers conferred under the Environment (Protection) Act, 1986.[vii]
Industrial noise emissions come from a wide variety of sources. However, they cannot be categorised easily as every industrial situation is different. This makes evaluation and mitigation much more difficult compared to other noise sources, such as traffic.
Noise sources differ widely in sound power, emitted frequency spectra, directivity and also in their time dependency. The characteristics of the emitted noise of industrial plant vary between irregularly propagated noise impulses and almost continuous noise levels from equipment and processes associated with production, manufacturing, and foundries.
Occupational-related hearing loss is one of the most common work-related illnesses worldwide. For example, in the United States, The Center for Disease Control (CDC) estimates that 22 million workers are exposed to potentially damaging noise at work each year.[viii] The regulatory limit set by countries for occupational noise tends to be 85 decibels (dB) for an 8-hour working day.[ix] Today, we assume that the danger of hearing loss is a given if people are exposed to a noise level of more than that. This risk increases with the magnitude and exposure time and the frequency of the noise; with higher frequencies doing more damage.
The main problem in noisy plants is finding and documenting where the noise reaches 85 dB, known as the ‘noise contour line’. In areas where noise levels exceed 85 dB, workers must wear hearing protection. If the 85 dB line is not clearly marked, companies may be liable to fines. If a plant has areas that may be close to or above 85 dB, it is wise to invest in a noise study to define all areas where hearing protection is required.
Testing out scenarios with data
Mapping software goes much further than measurements, which only record the overall level of noise as it occurs at a specific geographic point. A noise map shows the position of sources including all geometrical data and the noise levels inside and outside a building. Each noise map is unique, according to project size, geography, objectives, the relevant noise sources, but most of all, on what data is available and can be readily acquired to be imported and used.
Using this input data, noise mapping software can create realistic simulation models of how noise will propagate. The data can come from multiple different sources, graphical information systems or other mapping services, counts of traffic mix for road and railroads, manufacturers’ specifications, software libraries or any other source.
Different noise components, from a range of locations and from multiple sources, can be broken down, including machinery and equipment. This means that the impact can be evaluated across a range of locations, to show the sources of the loudest noise, and propagation across the site. It can also help show how well mitigation factors, such as a noise protection wall or soundproofing of equipment, may work.
The software gives you the option of developing ‘what-if scenarios’ so that the impact of developments or activities can be assessed in advance. Different options can be trialled and costed on the computer, rather than having to expensively retrofit noise mitigation measures. Future noise levels can be predicted, and pre-emptive steps taken to control it. With this approach, noise mitigation can be targeted in the most cost-efficient way.
Visualising the hazards
The mapping software produces graphical representations of the noise using colours to depict the different levels, which can be in 3D and animated formats, if required. This colour coding means the information can be easily understood, giving a very visual demonstration of where noise comes from and how it propagates.
After creating a noise map, you can introduce controls to start defending the environment and people against unwanted noise. Mapping software allows organisations to experiment with different scenarios to assess which is the most sustainable approach.
The software is fast, meets all major international noise standards, and provides users with an accurate calculation package with superb graphics supporting all levels of customer presentation.
Cost effective testing
The majority of environmental noise simulations are small to medium projects tasked with checking the legal compliance of an expansion to an industrial facility, for example.
Noise modelling software suited for these small to medium projects must be specially designed to quickly acquire the model data. Results must be obtainable speedily without much formatting, yet it must be customizable enough so the standards of your company can be represented, and you can be proud of your work.
As well as comprehensive noise mapping software, my organisation offers a version designed for users who only have an occasional requirement for a noise map. This helps them achieve reliable tabular and graphical results for a standard noise calculation with the investment of minimal time.
Getting the best from people and places
Data and technology, especially in the safety realm, are significant assets in the workplace. They safeguard people as well as profit, because the two are co-dependent. When you get the best out of people, success tends to follow. Knowing where the measurable dangers are means you can then apply safety practices that solve your problems – and don’t create superfluous ones that risk lives, waste time and resources.
[i] National Herald: https://www.nationalheraldindia.com/videos/indian-cities-rank-high-on-noise-pollution
[ii] World Health Organization infographic: https://www.who.int/multi-media/details/ear-and-hearing-care—searo
[iii] Kaur, H (2020) ‘The coronavirus pandemic is making the earth vibrate less’ (2020) CNN (https://edition.cnn.com/2020/04/02/world/coronavirus-earth-seismic-noise-scn-trnd/index.html)
[iv] Ellesmore, J. (2019) ‘Smart Cities: The Future Of Urban Development’ Forbes (https://www.forbes.com/sites/jamesellsmoor/2019/05/19/smart-cities-the-future-of-urban-development/#36f644492f90)
[v] http://smartcities.gov.in
[vi]http://www.indiaenvironmentportal.org.in/files/file/Noise%20Pollution%20(Regulation%20and%20Control)%20Rules,%202000.pdf
[vii] https://www.indiacode.nic.in/bitstream/123456789/4316/1/ep_act_1986.pdf
[viii]The Center for Disease Control: https://www.cdc.gov/niosh/topics/noise/default.html
[ix]ISO 1999:2013 https://www.iso.org/standard/45103.html and https://www.osha.gov/noise